Retention Score
One Number That Tells You If Customers Are Coming Back
Stop guessing whether your store is healthy. Retention Score distills repurchase rate, order frequency, and churn into a single 0–100 score you can track every week — and act on immediately.
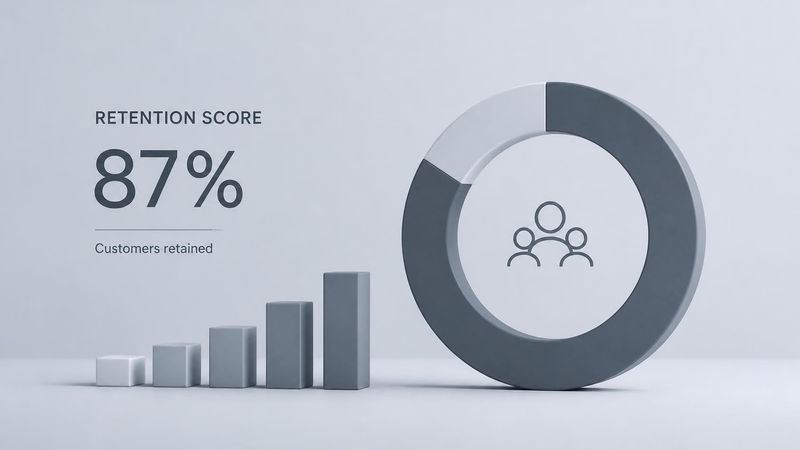
What Goes Into Your Score
A weighted formula built from the metrics that actually predict whether customers stick around.
Repurchase Rate
The percentage of customers who buy from you more than once. The single strongest predictor of long-term revenue.
Average Order Interval
How consistently customers return to buy again, compared against your store's historical baseline.
Category Benchmark
Your score compared against stores in your category, so you know if 68 is actually good or needs work.
Turn Your Score Into a Plan
Know exactly what to do at every score range.
| Score Range | What It Means | Recommended Action |
|---|---|---|
| 80-100 | Excellent retention | Focus on loyalty rewards & referrals |
| 60-79 | Healthy, room to grow | Target At-Risk segment proactively |
| 40-59 | Below category average | Launch win-back campaigns this week |
| Under 40 | Urgent attention needed | Full churn audit + discount strategy |
Frequently Asked Questions
It's a weighted formula combining your repurchase rate, average order interval, and churn rate, calculated fresh every week from your live Shopify order data. No manual input required.
Every new order, refund, and inactive customer shifts the underlying metrics. A rising score means more customers are returning; a falling score flags a trend worth investigating before it compounds.
Yes. Your score is benchmarked against stores in your category, so you always know whether your number reflects genuine strength or an industry-wide pattern.
You need at least 30 days of order history for an accurate first score. After that, RetentionFlow recalculates automatically every week.